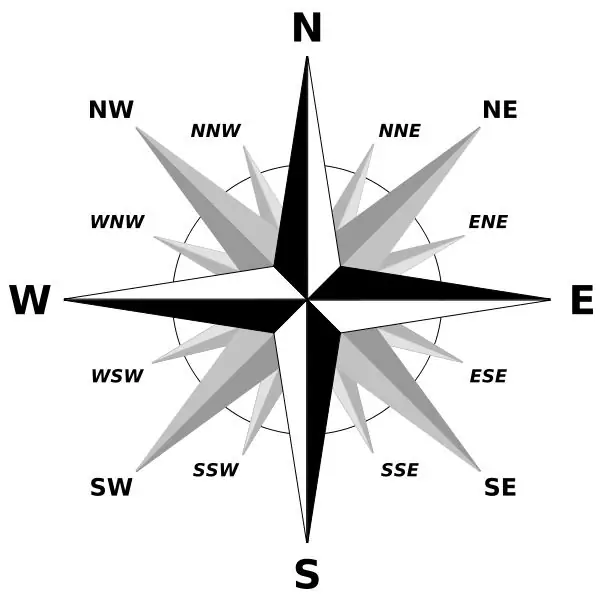
It is believed that the wind rose was invented by seafarers who needed to know the peculiarities of weather conditions for navigation. This information helped to understand when it is better to start sailing so that the wind is fair. The rose diagram is still used in design and construction.

It is necessary
Observational data on the direction of the wind in the studied period of time, paper, pencil, ruler, eraser
Instructions
Step 1
Draw two coordinate axes. Meteorologists keep records at 8 or 16 points. Depending on how detailed the wind direction observations were, draw two or six more axes. If you used 8 points (north, northeast, east, southeast, south, southwest, west, northwest), add two axes at 45 degrees to the first two.
Step 2
Plot the bisectors to the resulting angles at 45 degrees when observations were made at 16 points. That is, if more accurate directions were taken into account (north-north-east, east-north-east, south-south-west, etc.), then it is necessary to draw two more lines.
Step 3
Set aside equal segments along all the already constructed 8 axes and connect them with lines. Find the middle of each of them and draw a straight line through this point and the center of the drawing. We got four more axes of coordinates. Erase construction lines.
Step 4
Analyze observational data. Count the number of days the wind blew in each recorded direction. It is possible that in a given area air masses come only from selected cardinal points. This means that the wind rose will be clearly expressed.
Step 5
Set aside on the drawn coordinate axes the results of your calculations to scale. As a rule, a wind rose is drawn for a certain period of time: month, quarter, year. The larger the time interval, the smaller the scale should be. For example, if a diagram is being built for a month, then a cell of 5 mm can be taken as a unit.
Step 6
If you are making an annual average, then one day can represent one millimeter. Accept a different scale that suits your needs. Measure on each axis as many units of measurement as how many days the wind blew in that direction.
Step 7
Connect the marked points with lines. The resulting figure is the wind rose for the area for the selected period of time. The side of the light, where the largest segment protrudes, characterizes the predominant direction for air masses.


